
Environmental Chemistry1
Authors: J. M. McCormick and D. M. McCurdy*
Last Update: May 23, 2011
Introduction
The quality of water is of vital importance to the planet. The characteristics of water that allow it to be the universal solvent also make obtaining pure water almost impossible. As water moves through earth, air, rocks or pipes, material is dissolved in the water affecting its quality.
Nitrates and phosphates are common pollutants in water sources with runoff from lands where fertilizers have been used. Hard water results from the presence of iron, aluminum, manganese, strontium, zinc, magnesium, and calcium ions dissolved in water. Rain falling through an atmosphere rich in covalent oxides, such as nitrogen oxides, carbon oxides and sulfur oxides produces acid rain. Old pipes containing lead can result in lead ion concentrations great enough to cause lead poisoning. Aquatic life depends upon the concentration of dissolved oxygen in water. Drinking water often has additives to improve the health benefits of water. Chlorine, bromine or ozone may be added to kill bacteria in the water, while fluoride ions are added to strengthen tooth enamel.
Scenario
In this exercise you are a chemist employed by a private laboratory which has just been hired by a local city to monitor a stream that arises within the city limits and flows out of the city. Under Missouri state law, all streams are protected under the general criteria contained in the Missouri Water Quality Standards, 10 CSR 20-7.31(3). Of particular interest to the city as it relates to its compliance with the State law are the sections that state: waters shall be free from substances or conditions in sufficient amounts to result in toxicity to human, animal or aquatic life and waters shall be free from physical, chemical or hydrologic changes that would impair the natural biological community.
The object of your study is Bear Creek, a small stream that has its head waters just west of the Truman State campus within the city limits of the City of Kirksville, Adair County, Missouri. The creek flows in a general southeasterly direction across the campus. It is a tributary of the Salt River and ultimately empties into the Mississippi River north of Saint Louis. The Missouri Department of Natural Resources has identified Bear Creek2 as an endangered urban stream and a total maximum daily load (TMDL)3 was established for Bear Creek4 by action of the Federal Environmental Protection Agency (EPA) on December 23, 2010.5 The EPA identified three areas of concern: total nitrogen, total phosphorous and total suspended solids.
The area immediate area around Bear Creek and the sampling sites are shown in Fig. 1. The five sampling sites are: (1) north side of Patterson Street culvert, (2) north side of Randolph Street culvert, (3) bridge on walkway that runs between the Truman State Student Recreation Center and Centennial Hall, (4a) West Campus Suites Culvert, northwest side, (4b) West Campus Suites Culvert, northeast side, and (5) outflow on the west side of the Truman Student Recreation Center. These sites were chosen for their accessibility and their proximity to potential sources of pollution.
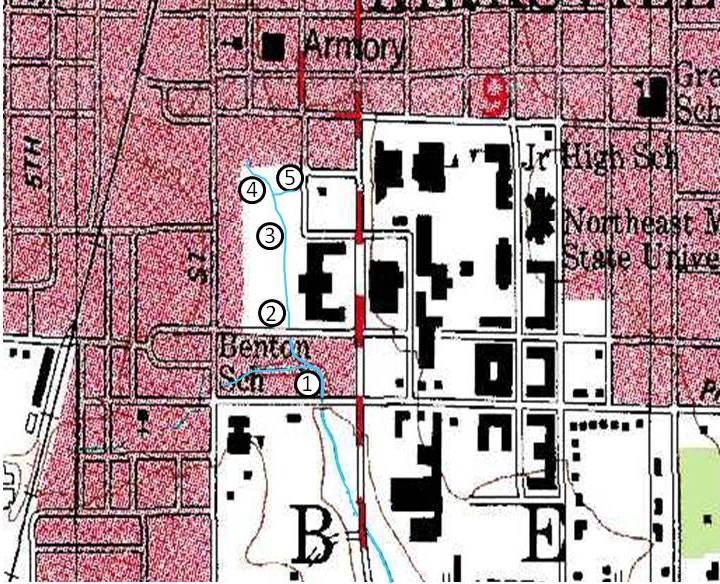
Figure 1. Map of the immediate area surrounding Bear Creek’s source.6 The approximate locations of the five sampling sites are shown.
The geology of the area is relevant to your analyses. The bedrock in the area is predominantly sedimentary in origin with limestone (CaCO3), shale and sandstone being common. Low-grade coal seams are not uncommon in this area and until recently coal mining was a major industry in Adair county. The entire area was glaciated during a previous ice age, and glacial debris forms much of the soil above the bedrock.
Your section is responsible for performing a set of analyses which will be provided to you by your instructor. Groups of three or four will determine the best way to perform one of these analyses based on the written standard procedures and collect your samples during week 1, and then perform the analysis during week 2. The results will then be presented to the section in week 3.
Experimental![]()
Your instructor will provide you with the experimental procedure that you will follow and additional background on your group’s assignment. You should note any and all hazards associated with your procedure, be they written in the procedure or verbally communicated to you by your instructor. Be sure that you note the amount of sample that your method requires so that you collect enough water in the first week to complete your analysis in the second week.
IMPORTANT! During the first week you will be obtaining your samples. You should come to the laboratory prepared to both work in the laboratory and to be outside for a significant amount of time.
IMPORTANT! While the sampling locations have been chosen for their accessibility, there is always a risk of physical injury in sampling natural systems. It is expected that you will dress appropriately and will behave in such a manner to put your safety and the safety of your coworkers first. By your participation in this activity you are agreeing to abide by all the laboratory safety rules while out sampling, all general safety rules and any special instructions given to you directly by your instructor or indirectly through a teaching assistant.
Results and Analysis
Work up your data as described in the informational packet that your instructor provided. At the very least, you will need to perform a statistical analysis (e. g., determine the 95% confidence limits) on your results and compare them to established standards. Note that for some of the procedures you will need to consult other sources to obtain some information.
Conclusions
Use the outline for a Measurement Experiment as the basis for your discussion of conclusions. Be sure to answer the questions posed in the Results and Analysis section above.
You will also be delivering a short group presentation on the results of your analysis. Your instructor will provide more details on what this will entail, but you should assume that you will need to give a short background on the problem you addressed, the method used and the theory behind the method, and present your results with a statistical analysis. The time limit for this presentation will be about 10 to 15 minutes. A basic outline and set of expectations for this presentation are available, but your instructor may modify these to fit the needs of your class.
- 1. Click here to download this file in PDF format. Note that hyperlinks are not active in the pdf version.
- 2. http://dnr.mo.gov/env/wpp/tmdl/info/0115u-01-bear-ck-info.pdf, accessed April 2, 2011.
- 3. http://www.dnr.mo.gov/env/wpp/tmdl/, accessed April 2, 2011.
- 4. http://dnr.mo.gov/env/wpp/tmdl/0115u-01-bear-ck-comments.pdf, accessed April 2, 2011.
- 5. http://www.dnr.mo.gov/env/wpp/tmdl/0115u-01-bear-ck-record.htm, accessed April 2, 2011.
- 6. Map taken from United States Geological Survey Kirksville Quadrangle 7.5 minute map, produced from photographs taken 1974 and lasted edited 1979. Available at http://store.usgs.gov/b2c_usgs/usgs/maplocator/(xcm=r3standardpitrex_prd&layout=6_1_61_48&uiarea=2&ctype=areaDetails&carea=%24ROOT)/.do, last accessed April 2, 2011.