
Spectrophotometric Determination of an Equilibrium Constant1,2
Authors: B. K. Kramer, B. D. Lamp, D. L. McCurdy* and J. M. McCormick
Last Update: April 21, 2011
Introduction
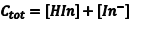
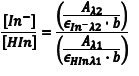
Typically acid-base indicators are themselves weak acids or bases whose acid and base forms have different colors in solution. As the result of the reaction with excess titrant, we convert one form to the other causing a color change that indicates the endpoint of a titration. If we represent the indicator’s acid form as HIn and its basic form as In–, then the following equilibrium describes the chemical reaction that occurs as the [H+] is changed. If HIn and In– have different colors, then the solution’s color will change as a function of [H+] depending on which of the compounds is present in the greater amount.

The acid dissociation equilibrium constant (Ka) for the indicator that describes this reaction is given by Eqn. 1, in terms of the concentrations of the hydrogen ion, In– and HIn. Because we are working in aqueous solution, it is convenient to rearrange Eqn. 1 to Eqn. 2 by taking the negative base-ten logarithm of both sides (More Info). By convention, we use the prefix “p” to denote the negative base-ten logarithm, and so -logKa becomes pKa and the -log[H+] becomes pH. This leads to a very convenient way of writing the very small [H+] that occur in aqueous solution as numbers that generally fall between 0 and 14. We can then rewrite Eqn. 2 as Eqn. 3 (which some of you may recognize as simply another version of the Henderson-Hasselbach equation). Note that Eqn. 3 predicts that the indicator’s pKa corresponds to the pH of an indicator solution when the logarithmic term equals zero (i. e., when [In–] equals [HIn]).
|
|
(1) |
 |
(2) |
 |
(3) |
A convenient way to determine the equilibrium constant of a reaction involving colored species and H+ is to use absorbance spectroscopy. If we monitor a wavelength at which either one of the two species strongly absorbs we will see the absorbance as a function of pH change as that species’ concentration in solution changes. From the equilibrium between HIn and In–, given above, and considering Le Chatelier’s principle, we can see that when the [H+] is large (low pH ), (Help Me) the equilibrium will shift completely to the left and the indicator will be completely in the HIn form.
Consider the experiment whose results are shown in Fig. 1. In this experiment, the absorbance of a solution of the indicator bromthymol blue is measured as the solution’s pH is varied. As the solution pH changes from acidic to basic, we observe an evolution from spectra where the peak centered around 430 nm (denoted by λ1) is largest, to spectra where the peak at about 630 nm (denoted by λ2) dominates. Further examination of the spectra reveals one wavelength, noted by a star, where the absorbance is essentially independent of pH. This is called an isosbestic point and results from the both forms of the indicator (HIn and In–) having the same molar absorptivity at this wavelength. It is not uncommon to see one or more isosbestic points in a set of spectra.
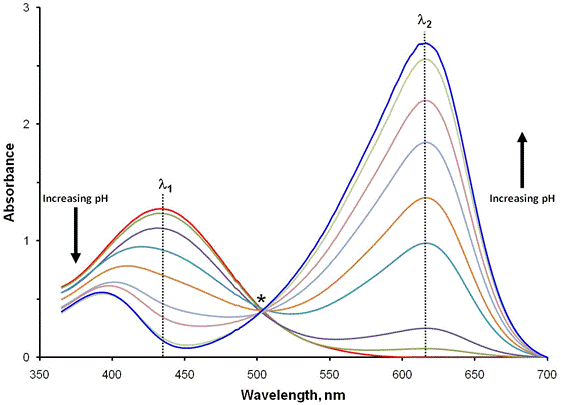
Figure 1. Spectra of the indicator bromothymol blue as a function of pH.
A closer examination of the trends in the spectra is shown in Fig. 2. When the solution is very acidic, as on the left side of Fig. 2, all of the indicator is in the HIn form, resulting in a large absorbance at λ1 (labeled Amax,λ1) but a small absorbance at λ2 (since [In–] is small). At high pH, all of the indicator is in the In– form giving a strong absorbance at λ2(labeled Amax,λ2) and minimal absorbance at λ1. As the pH changes from acidic to basic, the position of the equilibrium changes such that HIn is converted to In– in accordance with Eqn. 3. This conversion results in a decrease in [HIn] and a corresponding increase in [In–]. Since the absorbance at each wavelength is directly proportional to concentration, we observe a decrease in the absorbance at λ1 (because [HIn] decreases), and an increase in the absorbance at λ2 (because [In–] increases). It is important to realize that even though we may only be collecting absorbance values at two wavelengths in our experiment, the entire spectrum is undergoing a transformation as we cause the relative amount of HIn to decrease and In- to increase by increasing the pH of the system. In principle, we could choose any wavelength where HIn absorbs forλ1, and any wavelength where In– absorbs for λ2 in our analysis. In practice, however, it is beneficial to choose the wavelength of maximum absorbance for each species. Doing so provides the greatest sensitivity (ability to distinguish small changes in absorbance) for our measurement.
From Eqn. 3 is should be obvious that the pH where [HIn] = [In–] corresponds to the indicator’s pKa. This occurs when exactly half of the indicator is in the HIn form and half is present as In–. In terms of the experiment, this corresponds to the pH where the absorbance for each form is one half of its maximum, as shown by the dotted line in Fig. 2. Consequently, the pKa of an indicator corresponds to the pH of the solution at the inflection point in a plot of absorbance as a function of pH (More Info).
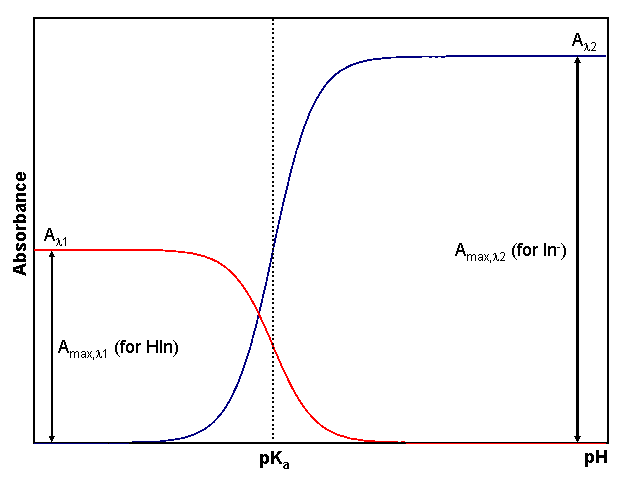
Figure 2. Dependence of absorbance HIn and In– on pH. The red line shows how the absorbance changes at a wavelength (λ1) where the acidic form of the indicator, HIn, absorbs strongly. The blue line indicates the behavior at a wavelength (λ2) where In–, the basic form of the indicator, absorbs strongly. The pH at which the inflection point in both lines occurs is the indicator’s pKa.
|
|
(4) |
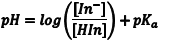
In practice it is difficult to precisely and accurately determine the inflection point in curves of this type. To get a more precise measure of the pKa, Eqn. 3 is rearranged to give Eqn. 4. This equation gives a straight line when the solution’s pH is graphed as a function of log([In–]/[HIn]). The slope of this line should be +1 and the y-intercept, where log([In–]/[HIn]) is zero (i. e. [In–] = [HIn]), is the pKa, as shown in Fig. 3.
Figure 3. Relationship between pH and log([In–]/[HIn]) for an indicator. The pKa of the indicator corresponds to the intersection of the line with the pH axis.
To use Eqn. 4 to determine the pKa of the indicator, it is necessary to know the pH of solutions that have different ratios of the two indicator species HIn and In–. Since the pH of the solution will determine the amount of the total indicator that will be in each form, it can be difficult to control exactly how much of the indicator exists as In– and HIn. It is possible, however, to use absorbance to obtain the ratio [In–]/[HIn]. We will simply monitor the absorbance at two different wavelengths. The first wavelength (λ1) is chosen where the acidic (HIn) but not the basic (In–) form of the indicator strongly absorbs radiation. The second wavelength (λ2) is chosen where the basic but not the acidic form strongly absorbs radiation.
|
|
(5) |
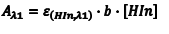
If Beer’s law is obeyed, the absorbance at λ1 is given by Eqn. 5 where Aλ1 is the absorbance at ε1, λHIn,λ1) is the molar absorptivity of HIn at λ1 and b is the cell path length. Since the amount of the indicator that is in the form of HIn depends on the pH, [HIn] can be difficult, or impossible, to determine. What is known, however, is the total concentration (CT) of the indicator in both forms since a known amount of the indicator was added to the solution at the beginning. At any pH the indicator’s CT is given by Eqn. 6. In solutions where the pH is sufficiently low, all of the indicator is in the acidic form, and consequently CT = [HIn]. Substituting CT = [HIn] into Eqn. 6 gives Eqn. 7.
|
|
(6) |
|
|
(7) |
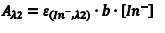
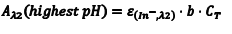
Likewise, at λ2 we can write an equation analogous to Eqn. 6 (Eqn. 8) where we have simply replaced the molar absorptivity of HIn with that of In– and the concentration of [HIn] with [In–]. In basic solution, CT = [In–], which leads to Eqn. 9.
|
|
(8) |
|
|
(9) |
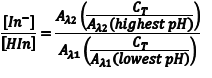
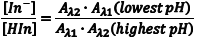
The ratio [In–]/[HIn] at any pH can be obtained by combining Eqn. 5 and Eqn. 8 to give Eqn. 10. Substituting equations Eqn. 7 and Eqn. 9 into equation Eqn. 10 gives Eqn. 11, which simplifies to Eqn. 12.
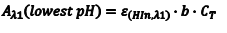
So the first step of our experiment will be to determine the value of Aλ1(lowest pH) andAλ2(highest pH). Aλ1(lowest pH) is the maximum absorbance at λ1 (Amax,λ1) in the solution with the lowest pH which should be only due to HIn. Aλ2(highest pH) is the maximum absorbance at λ2 (Amax,λ2) in the solution with the highest pH and it should be due to only In–.
|
|
(10) |
|
|
(11) |
|
|
(12) |
Until this point we have assumed that at λ1 the measured absorbance is due only to any HIn present and at λ2 all absorbance is due to In–. In fact, the basic form may absorb somewhat at λ1 and the acidic form may absorb at λ2. Because of this, the values of absorbance used in these equations must be corrected to take into account the amount of the absorbance that is due to the other species. To make this correction, we simply subtract the minimum absorbance measured at λ2 from each of the other measurements made at that wavelength. For example, Aλ2 = Aλ2(measured) – Aλ2(mimimum), where the value of Aλ2(mimimum) comes from the measurement made on the most acidic solution at λ2, the wavelength at which it should have the least absorbance. The same correction is to be made for λ1 by measuring the absorbance of the most basic solution at λ1.
Experimental
In this experiment, you will determine the pKa of bromothymol blue (3′,3″- dibromo-thymolsulfonephthalein) by the two methods which have been discussed. At a pH which is less than 6, the indicator is yellow and at a pH which is greater than 7.6, the indicator is blue. At an intermediate pH, the blue and yellow combine to yield a green solution. You will use the Spectronic 20 Genesys spectrometer to measure the absorbance of a bromothymol blue solution at the two specified wavelengths as a function of pH. You will also be using a pH electrode interfaced to the Logger Pro A/D converter to measure the pH of each solution that you make. Be sure that you have read and understand the operation of both instruments before coming to the lab. Note that there will be two or three spectrometers in the lab for this exercise and you may be sharing with up to three other tables.
Before coming to the laboratory prepare a table in the Results section of your laboratory notebook like that shown as Table 1.
| Flask Number | Absorbance at λ1 | Absorbance at λ2 | pH | Solution Color |
|---|---|---|---|---|
| 1 | ||||
| 2 | ||||
| 3 | ||||
| 4 | ||||
| 5 | ||||
| 6 | ||||
| 7 | ||||
| 8 | ||||
| 9 |
Table 1. Example of a table to record the results of this experiment.
Pipet 1.00 ml of the bromothymol blue stock solution into each of two 25-mL volumetric flasks. To one of the flasks add 5 mL of distilled or deionized water and 4 drops of concentrated hydrochloric acid; label this flask “Flask 1”. Dilute the solution to the mark with water. The resulting solution should have a pH of approximately 1. To the second flask add 12 drops of 4 M sodium hydroxide solution (CAUTION! the sodium hydroxide solution is very caustic) and fill the flask to the mark with water; label this flask “Flask 9”. The solution should have a pH of about 13.
Prepare the Spectronic 20 Genesys to obtain at 430 nm or at 630 nm according to the instrument’s operating instructions. You should discuss with the other groups sharing a particular spectrometer on how best make your measurements so as to use your time effective. Obtain and record the absorbance of the bromothymol blue solution at pH 1 (Flask 1) and at pH 13 (Flask 9) at both wavelengths. Be sure that you use the samecuvette throughout this experiment! Remove any bubbles from the cuvette by gentlytapping with your finger. Under absolutely no circumstances are you to tap a cuvette on a table top.
Label seven 25-mL volumetric flasks as “Flask 2” through “Flask 8”. Use a pipet to deliver 1.00 ml of the bromothymol blue solution to each of the flasks. Add the volumes of the 0.10 M Na2HPO4 solution and the 0.10 M KH2PO4 solution to each flask that are indicated in Table 2, below, using graduated cylinders. Dilute each solution to the mark with water.
| Flask Number | Volume of KH2PO4 Solution (mL) | Volume of Na2HPO4 Solution (mL) |
|---|---|---|
| 2 | 5.0 | 0.0 |
| 3 | 5.0 | 1.0 |
| 4 | 10.0 | 5.0 |
| 5 | 5.0 | 10.0 |
| 6 | 1.0 | 5.0 |
| 7 | 1.0 | 10.0 |
| 8 | 0.0 | 5.0 |
Table 2. Volumes of 0.10 M KH2PO4 solution and 0.10 M Na2HPO4 solution to be added to each volumetric flask.
Set up and calibrate the pH electrode using the Logger Pro software. Measure the pH of the solutions in all nine flasks, and record the pH of each solution in the table in your notebook. Be sure to copiously rinse the pH electrode with distilled water between each measurement and pat (do not rub) the electrode dry. When you have finished your measurements, place the electrode in the standard pH 7 buffer solution that you used to calibrate the electrode.
Measure the absorbance of each of the solutions in flasks 2 through 8 at each wavelength. Record the absorbance values in your table.
Results and Analysis
Input your data from Table 1 into Excel. Subtract the minimum absorbance at each wavelength (the minimum absorbance corresponds to the absorbance of the pH 1 solution at λ2 and to that of the pH 13 solution at λ1) from the absorbance of each of the nine solutions at that wavelength. The resulting absorbance values are now corrected for background absorbance. Prepare a graph of absorbance as a function of pH for the nine solutions at each of the two wavelengths. This should look like Fig. 2. Connect the points with a smooth line and determine a value of the pKa of the indicator from the inflection point in each plot. It is up to you to determine the best way to find the inflection points.
Using Eqn. 12 and the corrected absorbances calculate the ratio [In–]/[HIn] at each of the nine pHs (also do this in Excel). Graph pH as a function of log ([In–]/[HIn]), as in Fig. 3. From the best-fit line through the data determine the y-intercept and thus the pKa of bromothymol blue. Share your value with your laboratory section. Perform a Q-test on the class data, and discard an errant datum, if warranted. Calculate the estimated standard deviation on the class average pKa and the confidence limits on the average pKa at the 95% confidence level.
Conclusions
Use the outline for a measurement laboratory as a guide as your write your conclusions.
Your Summary Table should like Table 3. Be sure to include the confidence interval for the class pKa value.
| Our pKa | Number of Class Values | Class pKa |
|---|---|---|
Table 3. Example of a Summary Table for this exercise.
References
- 1. Click here to download this file in PDF format. Note that hyperlinks are not active in the pdf version.
- 2. Braun, R. D. Introduction to Chemical Analysis; McGraw-Hill; New York, 1982, pp. 197-199.