• Events
  • Directory
  • TruView Login
Truman Logo
  • About
  • Majors & Programs
  • Admission & Cost
  • Student Life
  • Alumni & Donors
  • Athletics

Compound X NMR Spectra

Compound X NMR Spectra
  • Truman ChemLab
  • General Information
    • The Laboratory Notebook
    • Before Laboratory
    • Laboratory Safety
    • SDS and MSDS
    • Glassware and Equipment
    • Instrumentation
    • Data Analysis
    • The Laboratory Report
    • Assessment
  • Course Specific Information
    • Chemistry for Contemporary Living
    • Chemical Principles
    • Inorganic Chemistry
    • Instrumental Analysis
    • Organic Chemistry
    • Physical Chemistry
    • Quantitative Analysis
    • Undergraduate Research
    • Chemistry of Art (JINS)
  • Help
    • Chemistry Contact Center
    • AXE Tutoring
    • Installing LoggerPro
    • Review Guides
    • Proofreader’s Marks
  • Forms
    • Crystal Model Request Form
    • NMR Class Submission Form
  • Databases and References
    • AIST Spectral Database
    • NIST WebBook
    • NMR Solvents

NMR Spectra of Compound X

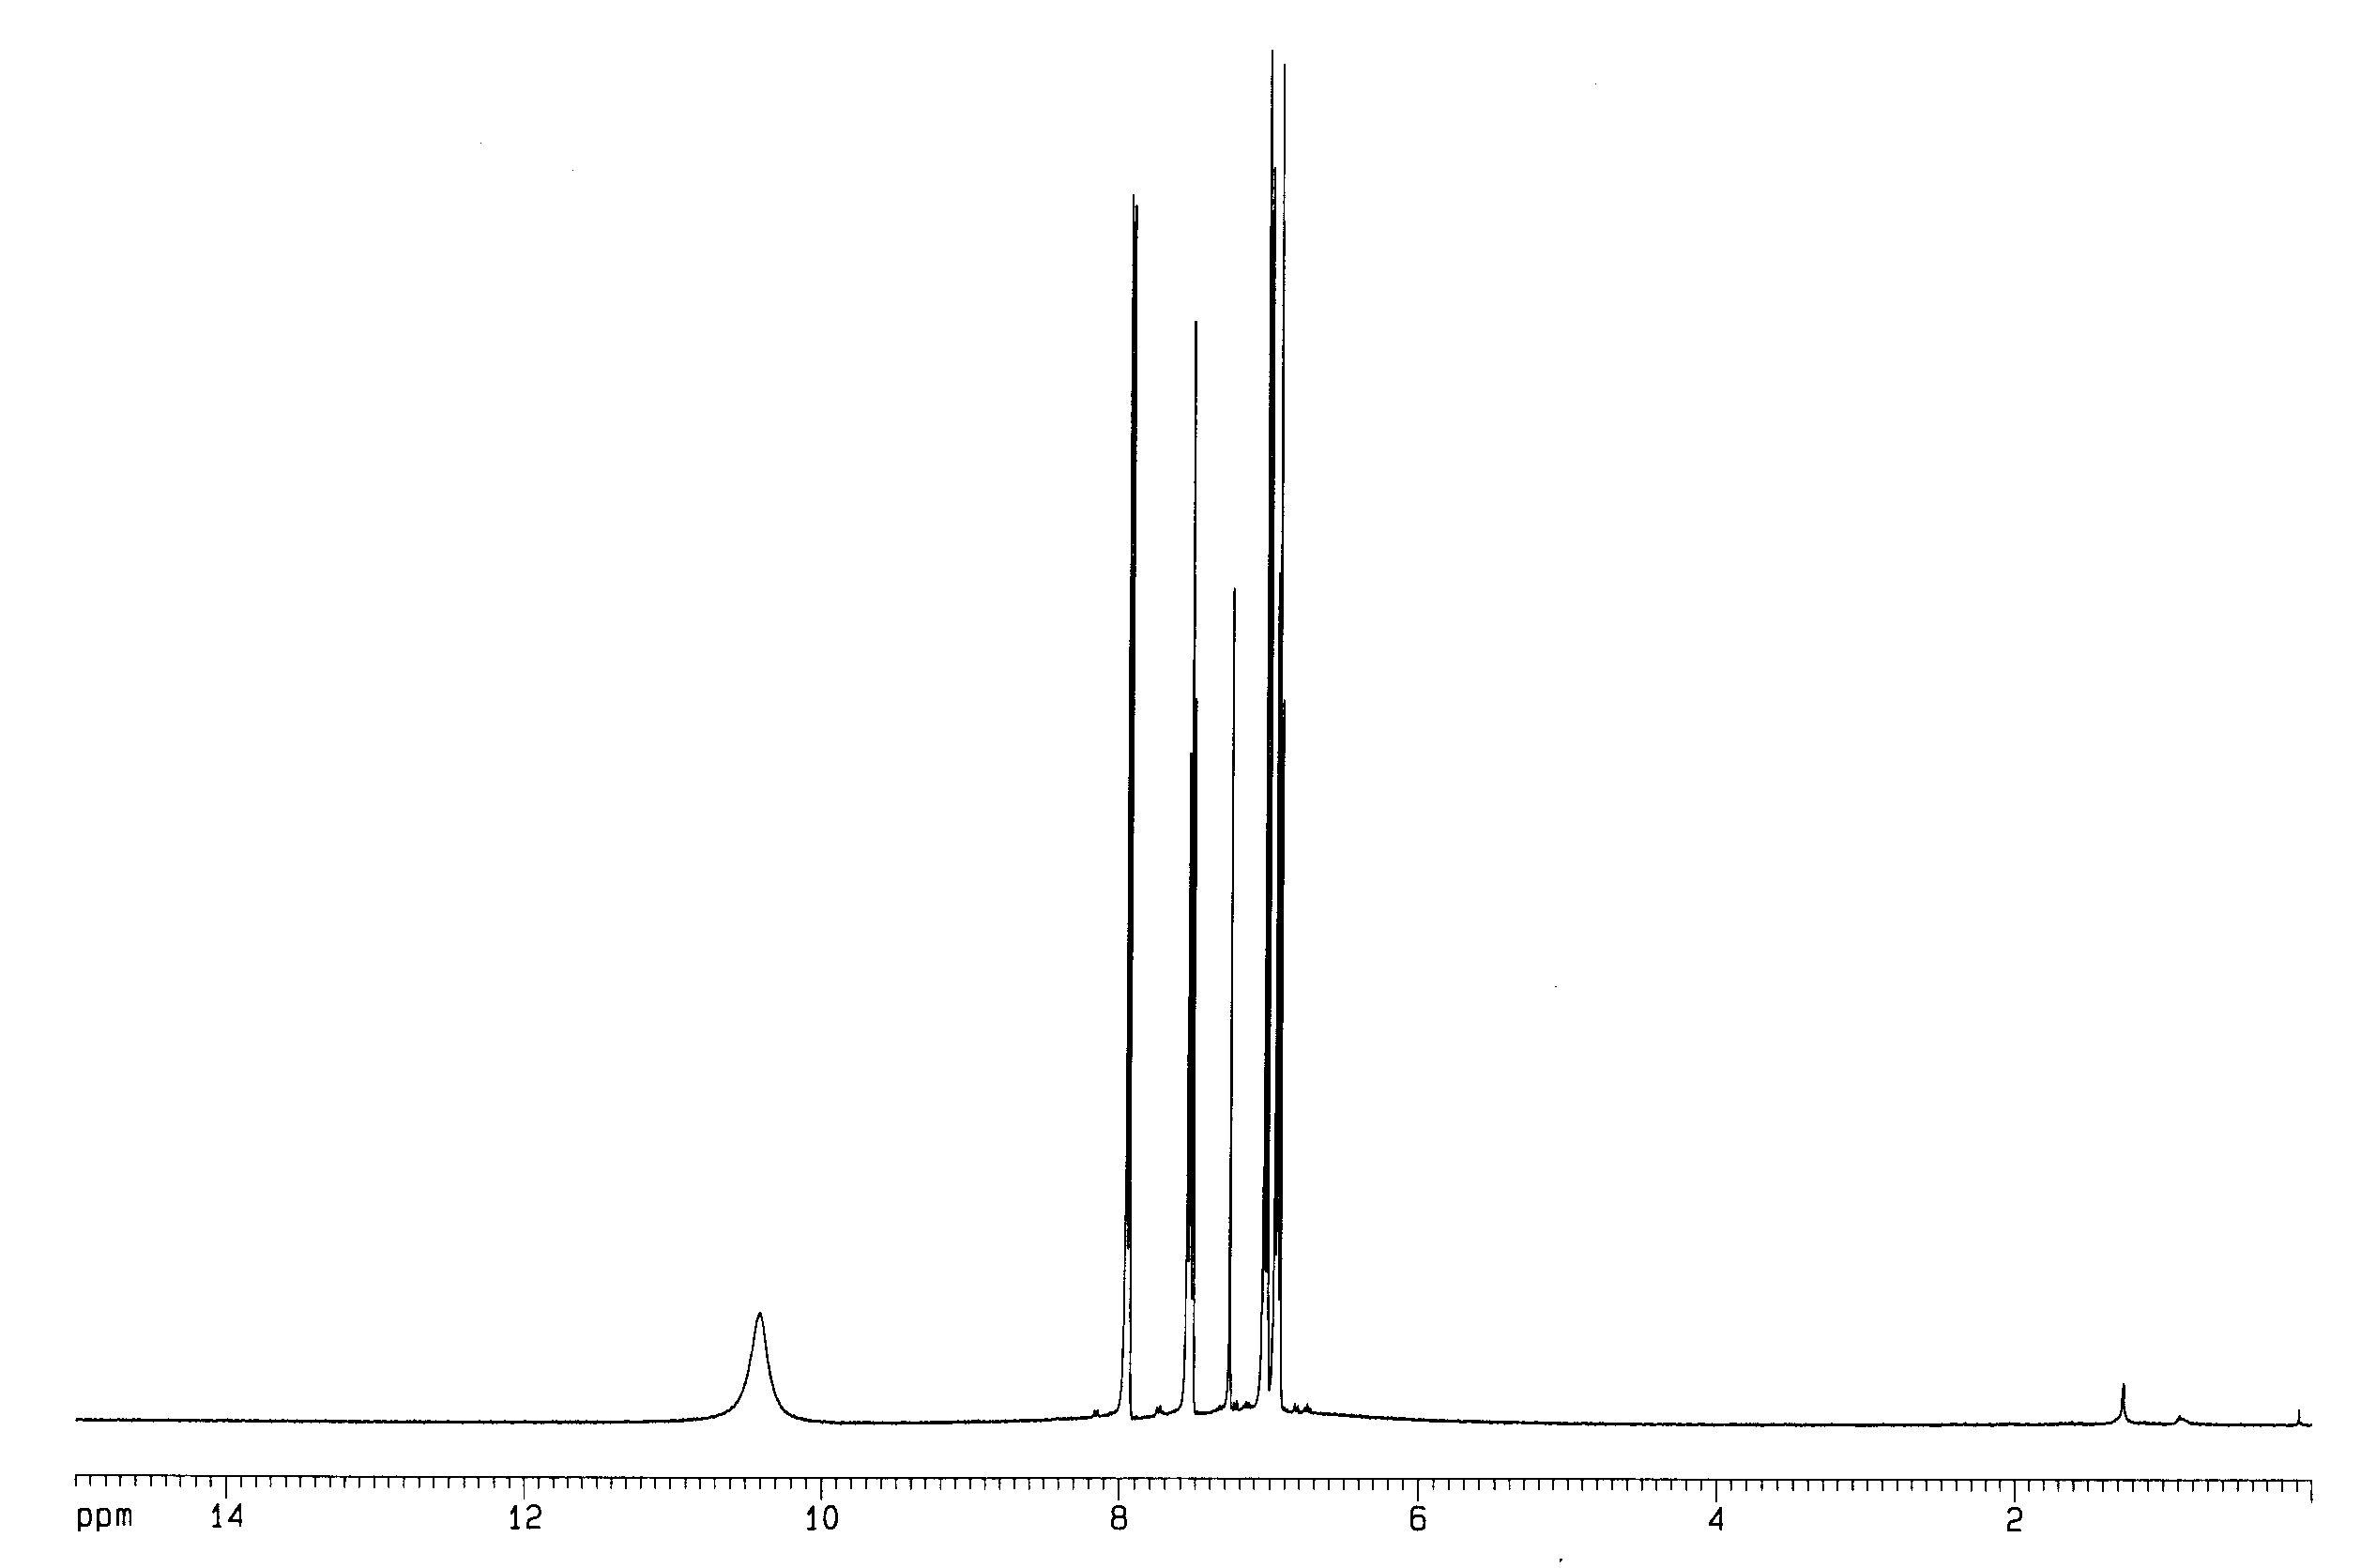
Figure 1.  Compound X‘s 1H NMR spectrum.  There is a very broad, weak peak that is very hard to see at around 7 ppm that integrates as 1 hydrogen.

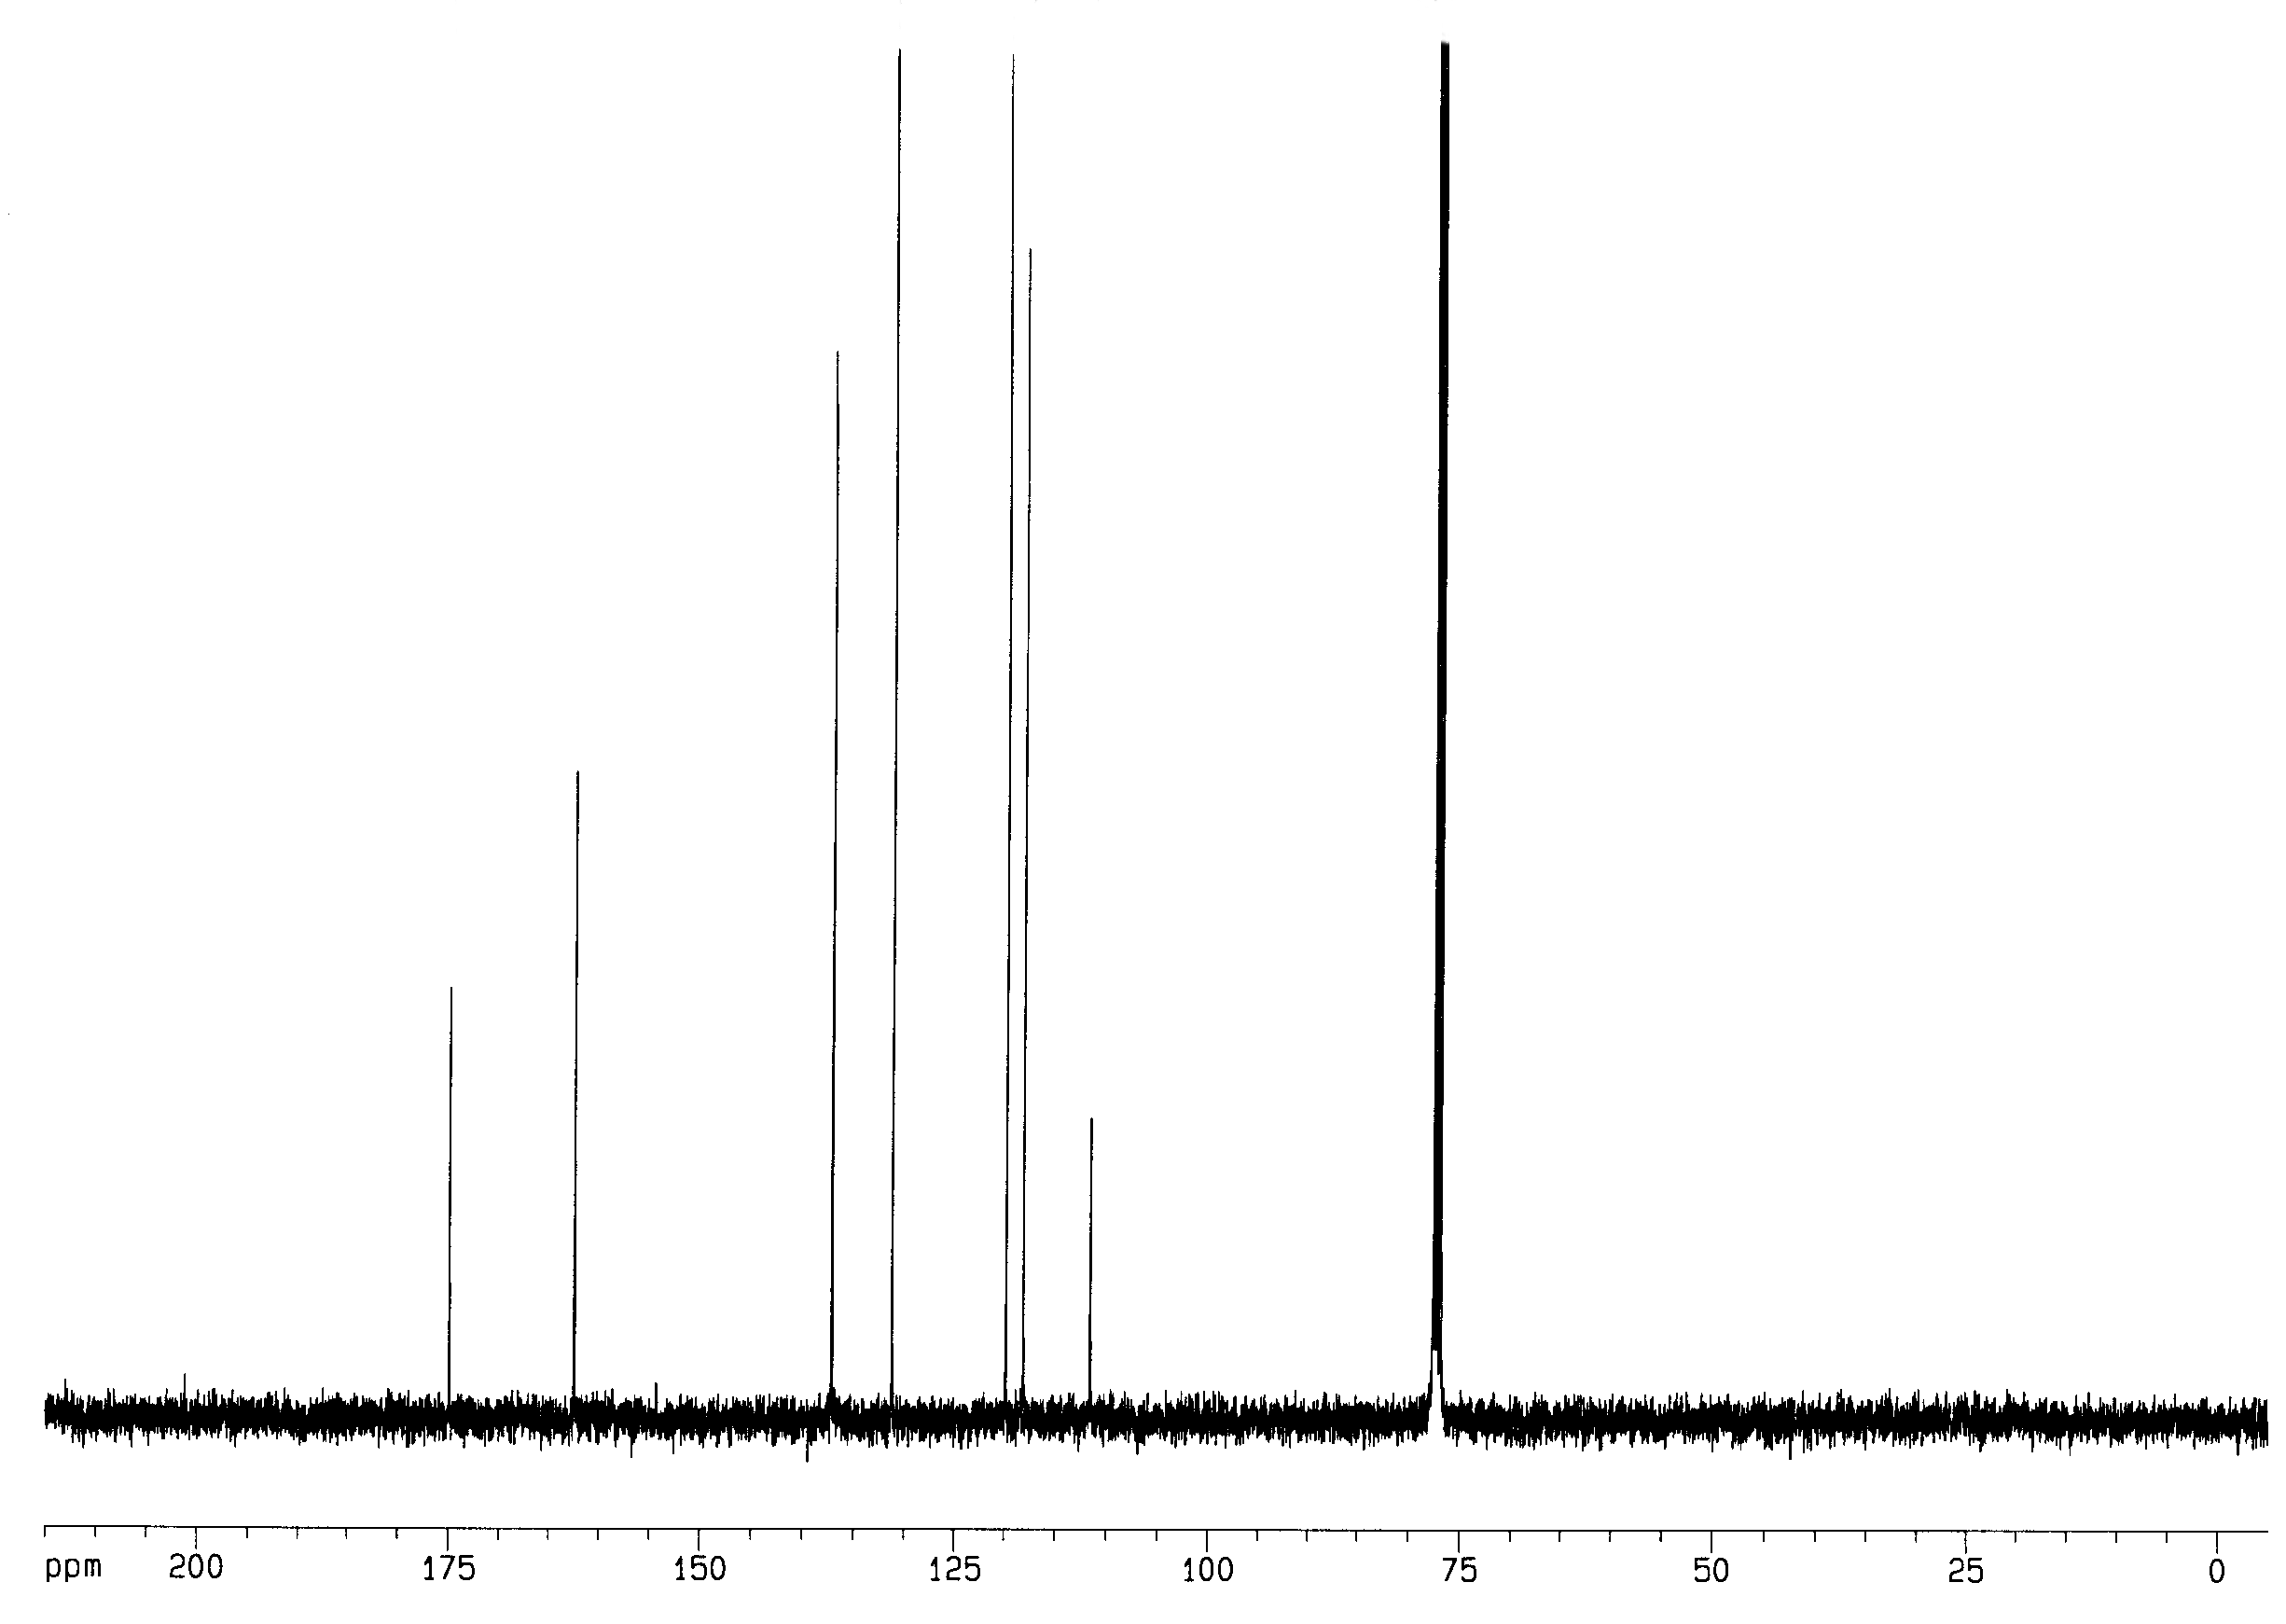
Figure 3.  13C NMR spectrum of compound X.  The peaks near 77 ppm arise from residual CHCl3.

Truman Logo
  • Contact Us
  • Maps & Directions
  • Campus Offices
  • Bookstore
  • Library
  • Important Policies
    • Notice of Nondiscrimination
    • University Non-Discrimination Policy
    • Complaint Reporting & Resolution
    • Accommodations for Persons with Disabilities
  • Consumer Disclosures
  • Institute for Academic Outreach
  • Site Map

Copyright ©2025
Truman State University
100 East Normal Avenue
Kirksville, Missouri 63501
660-785-4000

facebookIcon twitterIcon youTubeIcon
instagramIcon linkedInIcon snapchatIcon