Operating Ocean Optics Spectrometers with the LoggerPro Interface
Last Update: January 7, 2011
Basic Set Up and Calibration
First, set up the spectrometer and allow it to warm up (click here if your spectrometer is a one-piece unit or here if it consists of multiple parts to read instructions on how to set up the spectrometer). Start LoggerPro from the desktop shortcut, or from the Start menu on the lower left-hand side of the screen. If you can’t find LoggerPro by either of these methods, please consult your instructor.
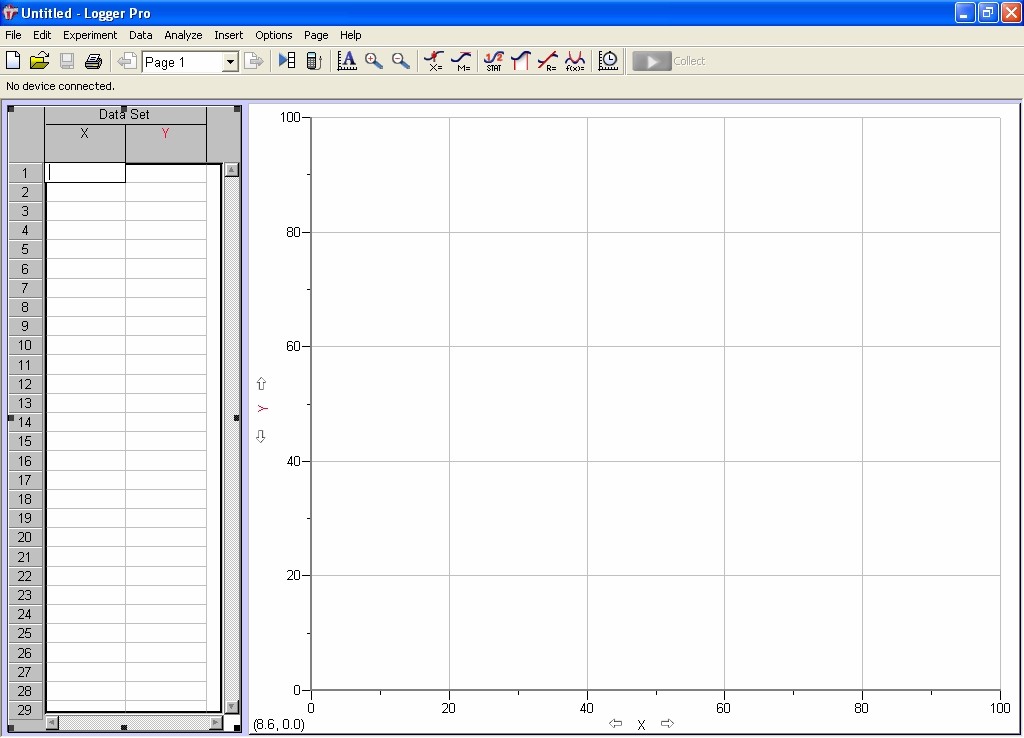
LoggerPro will start and the screen shown in Fig. 1 will be displayed. If status line displays the message “No device connected,” as it does in Fig. 1, you will need to connect the spectrometer. Do this by selecting Experiment from the menu bar and then select Connect Interface, Spectrometer and Scan for Spectrometer.
Figure 1. Starting screen for LoggerPro.
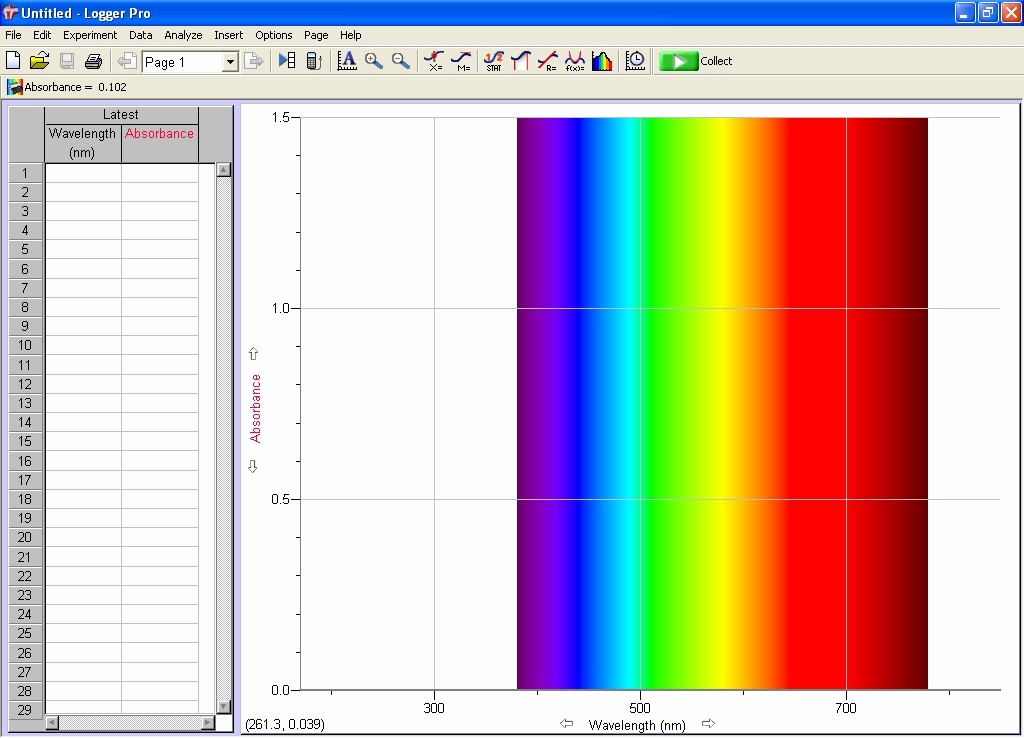
If program finds spectrometer, the “No device connected” message will be replaced by the spectrometer icon and the message “Absorbance = x.xxx” where “x.xxx” is some number, as shown in Fig. 2. You will also hear a click, if you are using one of the one-piece spectrometers.
Figure 2. LoggerPro screen that is displayed once the Ocean Optics spectrometer has been found by the software.
Once the computer has located the spectrometer, the software must configured to acquire the data. Click on the spectrometer icon (or select from menu bar Experiment, Set Up Sensors and select Spectrometer:1). The Set Up Sensors pop-up shown in Fig. 3 will appear. You probably won’t have to change anything there. However, if you do change something and want to return the spectrometer to its factory-default settings, simply click on the Restore Defaults button. Note that if you change something in this box after you have taken a background (vide infra), you will need to reacquire the background. Click here to read more about each parameter.
Figure 3. Set Up Sensors pop-up box for the Ocean Optics spectrometers.
Before continuing prepare a cuvette containing your blank. If you are using a spectrometer that has the detector and light source separated, you must place a thick piece of paper in the sample holder to block the light beam before proceeding.
In the Set Up Sensors pop-up click on the spectrometer icon and a new pop-up will appear. Your options here are Calibrate, Configure Collection and Current Units (underCurrent Units, Absorbance should be selected; do not change). Select Calibrate. If you have a one-piece spectrometer, it will click and the pop-up shown in Fig. 4 will be displayed. If you have a spectrometer where the detector and source are separate, you will not hear a click (make sure the light beam is still blocked).
Figure 4. Calibrate Spectrometer pop-up immediately after it has been activated.
After 1 minute the warm-up is complete and the Calibrate Spectrometer pop-up will look like that shown in Fig. 5. If you are using a one-piece unit, simply insert the blank into the spectrometer’s sample holder. The light travels across the spectrometer in the long direction, so make sure the cuvette is arranged so that the light travels through the unfrosted sides of the cuvette. If you have a spectrometer with separated detector and light source, first remove the piece of paper that you used to block the beam and then insert the blank into the sample holder. IMPORTANT! If you don’t have a one-piece spectrometer and did not block the beam, click Cancel and start the calibration again. Be sure that the unfrosted sides of the cuvette are pointed toward the fiber optic cables. Once the cuvette is in place click Finish Calibration to complete the spectrometer calibration. Close the pop-up by clicking OK when finished.
Figure 5. Calibrate Spectrometer pop-up after warm up is complete.
Simple Absorbance Measurements
If you have successfully complete all of the steps above, the Collect button ![]() should now be active and you are ready to acquire absorbance data as a function of wavelength (the default for the spectrometer). Just click on the Collect button
should now be active and you are ready to acquire absorbance data as a function of wavelength (the default for the spectrometer). Just click on the Collect button ![]() to acquire the spectrum and Stop button
to acquire the spectrum and Stop button ![]() when you are done. If wavelength is not on the x-axis, please check that the spectrometer is not in the Absorbance vs Wavelength mode, as described below. Click here to review the function of the other buttons on the LoggerPro tool bar.
when you are done. If wavelength is not on the x-axis, please check that the spectrometer is not in the Absorbance vs Wavelength mode, as described below. Click here to review the function of the other buttons on the LoggerPro tool bar.
Before configuring the spectrometer for a kinetics experiment, you must first calibrate the spectrometer, as described above.
Open the Set Up Sensors pop-up box again, click on spectrometer icon and selectConfigure Collection or click on the Configure Spectrometer Data Collection
icon on the tool bar. The window shown in Fig. 6 will open. Set the data collection mode toAbs(orbance) vs Time (for kinetics experiments) or Abs(orbance) vs Wavelength (used to obtain a spectrum). When Absorbance vs Time is selected, the check boxes under Full Spectrum are activated and you can choose which wavelength, or wavelengths, to follow as a function of time. When you check the Absorbance vs Time box, the program will automatically select a wavelength to monitor. If you used the Examine Data button
, the software will default to the wavelength that the cursor was last set to, otherwise the software automatically selects the first point in the list. With Absorbance vs Timeselected, you will be able to use the check boxes under the Full Spectrum heading to select the wavelength or wavelengths that you wish to monitor. Click OK when finished to close this window.
Figure 6. Configure Spectrometer Data Collection window.
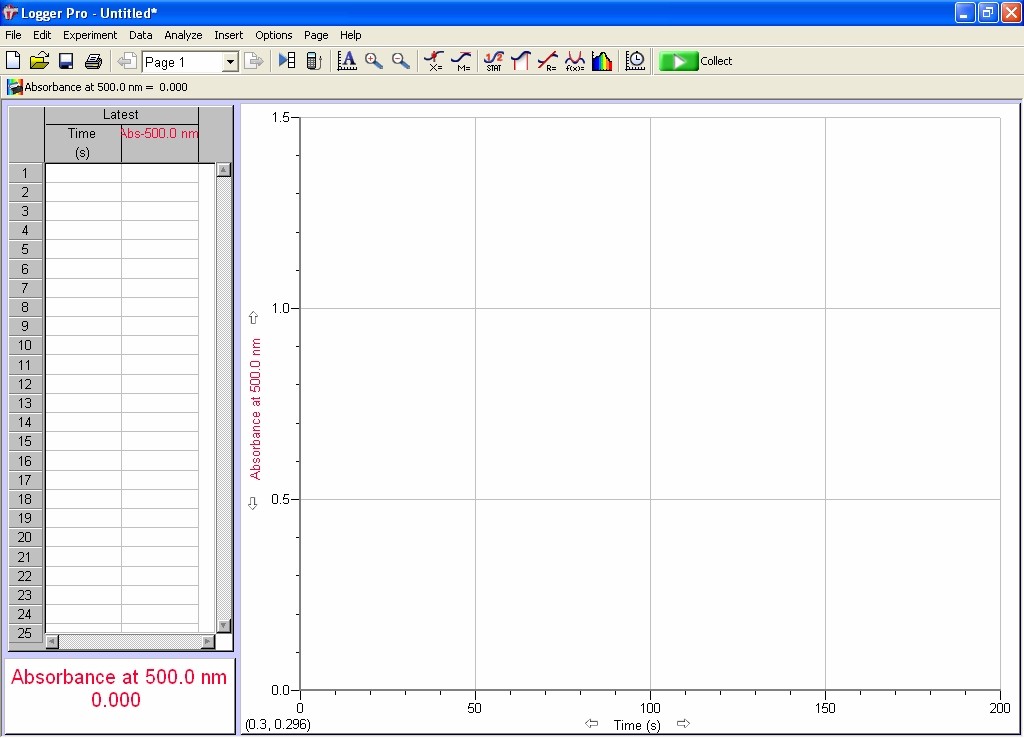
Upon closing the Configure Spectrometer Data Collection window, the main LoggerPro page should now have absorbance on the y axis and time on the x axis, as shown in Fig. 7. The current absorbance at the wavelength(s) that you specified will be displayed in the lower left-hand portion of the screen.
Figure 7. LoggerPro screen after the data collection mode has been set to absorbance as a function of time.
Now set the data acquisition parameters by clicking the Data Collection button on the tool bar (or from the menu bar by selecting Experiment, Data Collection). If you have successfully switched the spectrometer to time-based measurement mode, then the window shown in Fig. 8 will open. If not, then the data collection window for an absorbance as a function of wavelength measurement will appear (Fig. 9) and you will need to reset the collection mode. Note that if you try to change between a time-based measurement and a wavelength-based measurement without changing the data collection mode as described above, then you will see an error message and things will not work properly.
Figure 8. Data Collection window for time-based measurements.
Figure 9. Data Collection window for wavelength-based measurements.
In the Data Collection window for a time-based measurement, you need to set four parameters. First, select the Length of the experiment (enter the number in the first box and the units in the second). Check the Sample at Time Zero check box if you want the computer to measure the absorbance immediately at the start of the experiment (a good idea in most cases). Select Sampling Rate either using the slide bar or by typing a number into one of the boxes below the slide bar. Some important things to know about the sampling rate: 1) the units on the sampling rate are the same as those you selected in the Length of the experiment, 2) when you type a value in one the sampling rate boxes, the computer automatically calculates the other and 3) if you select a sampling rate that is faster than the spectrometer can actually do, a message will be displayed and you will not be allowed to proceed.
To have the spectrometer wait before it begins to record data (i. e., set a delay), select the Triggering tab and the window should now look like that shown in Fig. 10. Click on the Triggering check box to activate triggering and select either the On Keyboard or On Sensor Value options. On Keyboard means that the computer will wait until you press a key on the keyboard (the Enter key is a good choice) before it starts taking data, whileOn Sensor Value means that the computer will wait until the reading from the sensor is a particular value before beginning. Of the two On Keyboard is usually more useful.
Figure 10. Triggering control window.
If you enter “0” in the Collect ___ Samples before Trigger box, the software will start acquiring data only after you have started the run (see below) and hit a key on the keyboard. If you enter any other number in the Collect ___ Samples before Trigger box, the software behaves somewhat differently. Once you have started the run, you cannot start acquisition until the number of points that you specified have been acquired. Then and only then can you hit a key to initiate acquiring the rest of the data.
When you finish setting up the collection and triggering parameters for your experiment, click Done. You should now be ready to make a run. To initiate the run, push the Collect button ![]() . If you selected the On Keyboard trigger then the message “Waiting for keyboard trigger . . .” will be displayed in
. If you selected the On Keyboard trigger then the message “Waiting for keyboard trigger . . .” will be displayed in![]() the center of the graph. If you selected to acquire no data before the trigger, simply press a key on the keyboard to start acquisition. If you elected to acquire samples before the trigger, you will have to wait the amount of time required to obtain these data before pressing a key on the keyboard. Once acquisition has been triggered, the “Waiting for keyboard trigger . . .” message will go away and the first data point will be displayed.
the center of the graph. If you selected to acquire no data before the trigger, simply press a key on the keyboard to start acquisition. If you elected to acquire samples before the trigger, you will have to wait the amount of time required to obtain these data before pressing a key on the keyboard. Once acquisition has been triggered, the “Waiting for keyboard trigger . . .” message will go away and the first data point will be displayed.


