Absorption Spectra of Conjugated Dyes
Last Update: January 10, 2014
Introduction
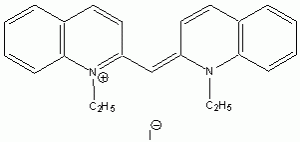
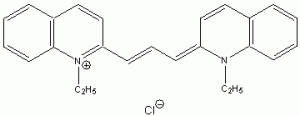
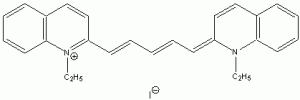
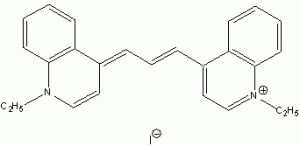
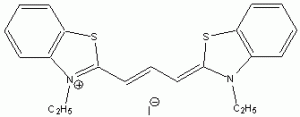
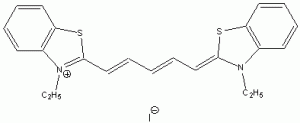
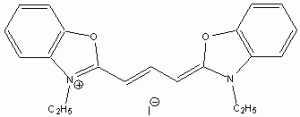
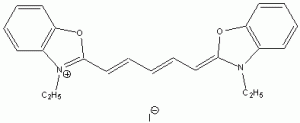
The wavelength of maximum absorbance (lmax) for the cyanine family of conjugated dyes, representative members of which are shown in Table 1, has a marked dependence on the number of conjugated carbons,1,2 while some also exhibit changes in lmax with solvent polarity, dye concentration and other factors. While the particle in the box model1-4 can be used to rationalize the trend in lmax, it does not explain the other effects. In this exercise you will explore the spectroscopy of the cyanine dye family, develop a testable hypothesis and then determine the validity of your hypothesis. For example, your hypothesis might be that the dye’s large second hyperpolarizability is the source of dependence of lmax on number of carbon atoms in the dye, which could be measured by light scattering. Unfortunately, this experiment cannot be done with the equipment that we have in the laboratory, but it is possible to test a number of hypotheses using only a UV-Vis spectrometer, the dyes in Table 1 and common laboratory solvents. To develop your hypothesis you must first read some articles describing the system, what is known about it, and some of the approaches that others have used to address these questions. Some references from the Journal of Chemical Education are included here to help you get started,5-12 and please discuss your ideas with the instructor.
Table 1. Representative members of the cyanine family of conjugated dyes.
Procedure
CAUTION! The toxicity of the dyes used in this lab should be considered unknown and as such all should be treated as toxic. Conjugated dyes are known sensitizers; take care when handling the dyes and wash your hands after handling them. The dyes are light sensitive, and so if it is necessary to store the dye solutions, protect them from light.
Use the references 3 and 4 to develop an experimental procedure. IMPORTANT! You may not need to know the concentration precisely and it is usually sufficient to use only a few micrograms (a single crystal) in a 3-mL cuvette, as long as the dye’s maximum absorption is less than approximately 1 absorbance unit. These dyes are typically $100-$300 per gram and so it is important not to waste the materials. It is possible to obtain the absorption spectrum of all the dyes in Table 1 (all in the same solvent), and generate only 100 mL of waste. Any group that produces more waste than that will be penalized accordingly.
You will record the UV-Vis absorption spectrum of each dye using either the Varian or Ocean Optics spectrometers available in the laboratory. If you are using the Varian it is suggested that you set it to record data every 1 nm and that the scan speed be set to no more 300 nm/min. Save your spectra as ASCII text files for importing into Excel. Use the spectrometer software’s peak picking routine to determine each transition’s lmax. It is advisable not to try to do the peak picking in Excel; it is fairly tedious.
The literature procedures call for the use of methanol as a solvent.3,4 If you wish to explore the effect of solvent it is suggested that you use other polar organic solvents (e. g., tetrahydrofuran, acetonitrile, etc.) because of the poor solubility of these dyes in non-polar solvents and in water. Be sure to select solvents that do not absorb light in the same wavelength region as your dyes.
Results and Analysis
Report the final absorption spectra for each dye you studied. You will want to present a series of dyes on the same graph, and so you must clearly indicate which spectral trace arises from which dye. Donot put all 11 spectra on a single graph as this will be a big mess! Note that although your spectra are experimentally determined (and so one would think that they should be shown as individual points), it is common practice to show spectra as solid lines, unless there is good reason to do otherwise.
Carry out the necessary calculations and propagate the errors involved to the final answer. Be sure to read the questions raised in the texts3,4 as they may give you insight into the problem and suggest issues that you should address as part of your discussion.
1. Platt, J. R. J. Chem. Phys. 1954, 22, 1448.
2. Kuhn, H. J. Chem. Phys. 1949, 17, 1198.
3. Shoemaker, D. P.; Garland, C. W. and Nibler, J. W. Experiments in Physical Chemistry, 7th Ed.; McGraw-Hill: New York, 2003, p. 380-385.
4. Halpern, A. M. and McBane, G. C. Experimental Physical Chemistry: A Laboratory Text book, 3rdEd.; Freeman: New York, 2006, p. 39-1-39-9.
5. Farrell, J. J. J. Chem. Educ. 1985, 62, 351. Click here to view this article (Truman addresses and J. Chem. Educ. subscribers only).
6. Gerkin, R. E. J. Chem. Educ. 1965, 42, 490. Click here to view this article (Truman addresses and J. Chem. Educ. subscribers only).
7. Casaubon, J. I. and Doggett, G. J. Chem. Educ. 2000, 77, 1221-1224. Click here to view this article (Truman addresses and J. Chem. Educ. subscribers only).
8. Shalhoub, G. M. J. Chem. Educ. 1997, 74, 1317-1319. Click here to view this article (Truman addresses and J. Chem. Educ. subscribers only).
9. Horng, M.-L. and Quitevis, E. L. J. Chem. Educ. 2000, 77, 637-639. Click here to view this article (Truman addresses and J. Chem. Educ. subscribers only).
10. Moog, R. S. J. Chem. Educ. 1991, 68, 506-508. Click here to view this article (Truman addresses and J. Chem. Educ. subscribers only).
11. Soltzberg, L. J. J. Chem. Educ. 2001, 78, 1432. Click here to view this article (Truman addresses and J. Chem. Educ. subscribers only).
12. Autschbach, J. J. Chem. Educ. 2007, 84, 1840-1845. Click here to view this article (Truman addresses and J. Chem. Educ. subscribers only).

