Kinetics of a Flash-Induced Isomerization Reaction
Adapted from an Exercise developed by the Physical Chemists at the University of Kansas by J. M. McCormick
Last Update: July 13, 2009
Introduction
When a molecule absorbs a photon, the photon’s energy is transferred to the molecule and the molecule enters an excited state. The molecule obviously wants to rid itself of this excess energy and does so by a process known as relaxation. In general relaxation pathways fall into two broad categories: photochemistry and photophysics. In a photochemical relaxation pathway the light initiates a chemical reaction, which implies a change in structure via an intramolecular or intermolecular process. This change in structure may be permanent as in bond cleavage followed by bond formation to form a new molecule, or transient in nature such as an isomerization reaction followed by the reverse reaction to give the initial species in its ground state. There are many examples of light-induced chemical process in chemistry and biology (e. g., the Diels-Alder reaction and photosynthesis). The majority of molecules do not undergo a chemical reaction upon excitation by light, but relax through photophysical pathways. These processes return the molecule to the ground state, but do not result in any structural changes. Examples of photophysical processes include fluorescence, and vibrational relaxation.
One of the most important developments in the study of kinetics was the development of the flash photolysis technique by Norrish and Porter.1 The method of flash photolysis is conceptually simple; a flash of light from a lamp or laser excites a molecule, which then begins to relax. During the relaxation process the molecule may go through a number of intermediates and the concentration of these intermediates may be followed by measuring the absorption of any one of them as function of time. If molecule A is excited by a photon to the excited state, denoted A*, it may return to its ground state according to the mechanism shown in Scheme 1.
| Excitation of Flash Process | A + hv → A* | k1 |
| Photochemical Reaction | A* → B | k2 |
| Reverse Photochemical Reaction | B → A | k3 |
Scheme 1. Possible mechanism by which a photoexcited molecule, A*, returns to its ground state, A, via an intermediate, B.
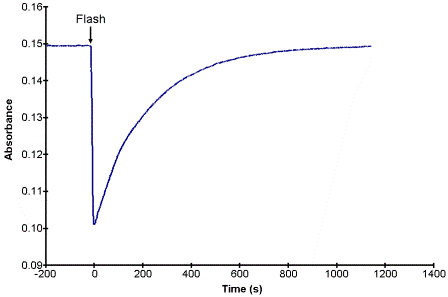
If the excitation or the flash process is considered to be instantaneous (k1 is very large) then the concentration of B will be determined by two rate constants, k2 and k3 for the steps that follow the flash. If we assume that k2 >> k3, then the absorbance of A as a function of time might look like that shown in Fig. 1, assuming that the absorbance of B at the monitored wavelength is less than that of A. In this case the decay is a simple first order process and the time constant of the decay is equal to the rate constant k3.

Figure 1. A potential kinetic trace for the conversion for the flash-photolysis reactions in Scheme 1.2
The only limitation to the flash photolysis method is that only events slower than the duration of the flash or light pulse width can be measured. Current state-of-the-art flash photolysis experiments can resolve events occurring on the 10-15sec (femtosecond) time scale, sufficiently fast enough to probe most chemical processes. It should be noted that while photolysis formally refers to the cleavage of a chemical bond, the term “flash photolysis” is used in conjunction with the use of the time-resolved approach described above to follow the kinetics of a chemical reaction. Thus, the term “flash photolysis” should not be considered to imply bond breaking.

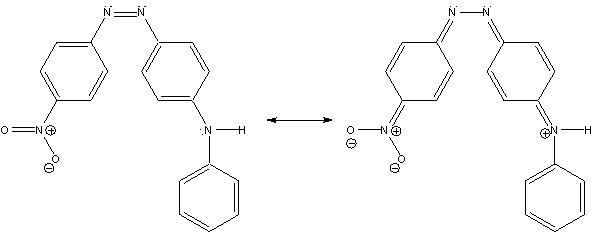
Figure 2. Resonance structures of cis-4-anilino-4’-nitroazobenzene (cis-4A4N).
The molecule that will be studied in this exercise is cis-4-anilino-4’-nitroazobenzene (cis-4A4N) and is a constituent of the commercially available dye Disperse Orange 1.2 This compound is a “push-pull” molecule which means it has an electron-donor group (the anilino group) and an electron-acceptor (the nitro group) in the same molecule. This results in a contribution from the resonance structure shown on the right side of Fig. 2, and a weakening of the N=N bond due to some single-bond character. The trans isomer is the more stable isomer, but upon photoexcitation it will undergo the light-induced reactions shown in Scheme 2.
| Excitation Process | trans-4A4N + hv → trans-4A4N* |
| Excited State Isomerization | trans-4A4N* → cis-4A4N* |
| Phototypical Relaxation | cis-4A4N* → cis-4A4N |
| Ground-State Isomerization | cis-4A4N → trans-4A4N |
Scheme 2. Light-induced reactions of trans-4A4N.
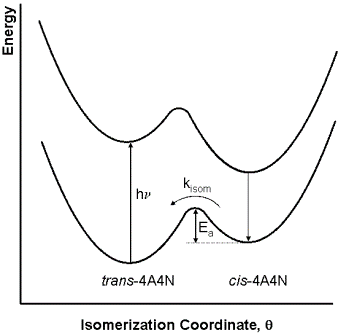
A schematic of the reaction as a function of the isomerization coordinate is shown in Fig. 3. The Ar-N=N-Ar

Figure 3. Energy profile for the photo-induced isomerization of trans-4A4N to cis-4A4N followed by the conversion ofcis-4A4N back to trans-4A4N.2
isomerization coordinate, where Ar stands for the aromatic groups attached to the nitrogens, is described by an angle θ, where θ = 0° corresponds to the cis isomer and θ = 180° corresponds to the trans isomer. Note that in the photophysical relaxation step (cis-4A4N* → cis-4A4N) is not shown to involve photon emission as it might also be accomplished through what are called non-radiative decay processes. The first three reactions in this mechanism occur on a time scale that is much too fast to be resolved in this experiment. However, the ground-state isomerization reaction takes place on a time scale of several minutes, and can thus be followed using conventional spectrometers.
The activation energy, and thus the rate, of photo-induced isomerization of 4A4N has been shown to depend on the solvent.2 You will extend this study in a way of your choosing. The results and the references given in reference 2 may be used as a starting point, but you will need to do additional literature searches to fully develop your project. It is suggested that spend the first week attempting to reproduce at least some of their results before proceeding with any new work. Please discuss your ideas with the instructor before starting any work (other than reproducing the results in reference 2) in the laboratory.
Procedure
The given procedure follows closely the literature procedure,2 and so only a few important additions and clarifications are noted here. The week before the experiment is to be performed, prepare ~10-6 M 4A4N solutions (a precisely-known concentration is not critical). Reference 2 used cyclohexane, tetrahydrofuran and acetone, but you may select others remembering that the solvent must not absorb at the excitation wavelength. Note that the dye Disperse Orange 1 contains only ~25% by weight 4A4N. Some of the salts in the dye are not soluble in organic solvents so it may be necessary to decant or filter the solutions. In addition, 4A4N itself is not very soluble in cyclohexane. You will not need more than 50 mL of any dye solution (the cuvettes require only 3 mL of solution and most solutions can be flashed multiple times), and can probably get by with less.
Store the dye solutions in aluminum-foil wrapped brown bottles and place them in a dark place to assure that the majority of the 4A4N is in the trans form.2 Care should be taken at all times to minimize the exposure of the dye solutions to ambient light. CAUTION! the solvents used in this experiment are flammable, and some have been known to cause adverse health effects. The health effects of 4A4N have not been thoroughly characterized. Know the safety precautions necessary to work with these materials and use all due caution when handling them.
Using an Ocean Optics spectrometer, a jacketed cell holder set at the appropriate temperature, and a quartz cuvette, obtain an absorption spectrum for each solution and determine the wavelength of maximum absorption, λmax, for trans-4A4N in each solvent. Save these spectra for presentation in the laboratory report (remember spectra are almost always shown as lines on graphs). For the kinetics experiments set the spectrometer to monitor λmax as a function of time. You will need to adjust the sampling rate and the overall time of the experiment for each solvent to optimize the number of data points recorded. This time may range anywhere from 50 sec to over 200 sec. Save each kinetics run in Excel (cut and paste the data from LoggerPro). Be sure to set your acquisition time long enough to get an accurate measurement of the absorbance at infinite time. This should be the same as the initial absorbance measurement. If it is not, then the sample was not fully equilibrated in the trans form at the start of the experiment. You can either re-equilibrate (requires waiting a week, but this does not guarantee success) or use the Guggenheim method.3
The flash source for the experiment will be a simple camera flash attachment with the filter removed. CAUTION! Do not touch the flash element itself; it is fragile and will be hot from use. To perform a run, place the cuvette containing the sample in the spectrometer and start acquiring data. At some convenient time, charge the flash by turning it on (it will whine and the red “Test” button will light when it is fully charged). Quickly remove the cuvette from the sample holder, place the flash close to the polished cuvette faces and press the “Test” button. Immediately return the cuvette to the sample holder. If you are quick enough and have set the time between acquisitions long enough, your kinetics curve should look like that shown in Fig. 1. For each solvent obtain at least three replicate data sets. When finished, dispose of the solutions in the appropriate waste container.
Results and Analysis
Show a representative kinetics trace from one of your runs, which should look like Fig. 1 (except you will show actual data points), in the Results section. The absorbance of the trans isomer at any time, At, can be related to its initial value, A0 and its value at infinite time, A∞, by Eqn. 1.2 Prepare the appropriate graph to calculate the rate constant for the cis to trans isomerization of 4A4N in each solvent include a representative example of each in the Results.
| (1) |
If you determined Ea (and A) for the reaction, show a representative Arrhenius plot, but note that you might be able to place several data sets on one graph. Report your results to the correct number of significant figures, and give the uncertainty at the 95% confidence level. Compare the observed uncertainty, as determined from the replicate kinetics runs in each solvent, with that predicted by a propagation of error analysis. Are the values that you found in agreement with the literature values? Perform a significance test to justify your claim.
In your discussion address what aspect of this reaction your experiment sought to probe and how it relates back to what must physically happen to the molecule for the isomerization to occur. Is there evidence to support the claim that solvent polarity affects the rate of this reaction? Compare your results (both the rate constant and the activation energy) to what the expected solvent effect is. Compare your results (especially when you attempted to reproduce the results in reference 2) to those given in reference 2; explain any discrepancies.
- 1. Norrish, R. G. W. and Porter, G. Nature 1949, 164, 164.2. Hair, S. R.; Taylor, G. A. and Schultz, L. W. J. Chem. Educ. 1990, 67, 709. Click here to view this article (Truman addresses and J. Chem. Educ. subscribers only).3. Shoemaker, D. P.; Garland, C. W. and Nibler, J. W. Experiments in Physical Chemistry, 7th Ed.; McGraw-Hill: New York, 2003, p. 286.
